seaborn.lineplot
译者:cancan233
seaborn.lineplot(x=None, y=None, hue=None, size=None, style=None, data=None, palette=None, hue_order=None, hue_norm=None, sizes=None, size_order=None, size_norm=None, dashes=True, markers=None, style_order=None, units=None, estimator='mean', ci=95, n_boot=1000, sort=True, err_style='band', err_kws=None, legend='brief', ax=None, **kwargs)
用不同语义分组绘制线型图
x和y之间的关系可以使用hue,size和style参数为数据的不同子集显示。这些参数控制用于识别不同子集的视觉语义。通过使用所有三种语义类型,可以独立地显示三个维度,但是这种画图样式可能难以解释并且通常是无效的。使用冗余语义(即同一变量的hue和style)有助于使图形更易于理解。
请查看指南获取更多信息。
默认情况下,图标在每个x值处汇总多个y值,并显示集中趋势的估计值和该估计值的置信区间。
参数:x,y: data或向量数据中变量的名称,可选择。
输入数据变量;必须是数字。可以直接传递数据或引用
data中的列。
hue: data或向量数据中的变量名,可选。
分组变量,将生成具有不同颜色的线条的变量。可以是分类或数字,但颜色映射在后一种情况下的行为会有所不同。
size: data或向量数据中的变量名,可选。
分组变量,将生成具有不同粗细的线条的变量。可以是分类或数字,但大小映射在后一种情况下的行为会有所不同。
style: data或向量数据中的变量名,可选。
分组变量,将生成具有不同样式和/或标记的线条的变量。可以是一种数字形式,但是始终会被视为分类。
data: 数据框架。
整洁(“长形式”)数据框,其中每列是变量,每行是观察量。
palette: 调色板名称,列表或字典,可选。
用于
hue变量的不同级别的颜色。应该是color_palette()可以解释的东西,或者是将色调级别映射到 matplotlib 颜色的字典。
hue_order:列表,可选。
指定
hue变量级别的出现顺序,否则它们是根据数据确定的。当hue变量是数字时不相关。
hue_norm: 原则或者时归一化对象,可选。
当数值为数字时,应用于
hue变量的颜色图数据单元的归一化。 如果是分类的,则不相关。
sizes:列表,字典,或者元组。可选。
确定在使用
size时如何选择大小的对象。它始终可以是大小值列表或size变量与大小的字典映射级别。当size是数字时,它也可以是一个元组,指定要使用的最小和最大大小,以便在此范围内对其他值进行规范化。
size_norm:原则或者时归一化对象,可选。
当
size变量是数字时,用于缩放绘图对象的数据单元中的归一化。
dashes: 布尔值,列表或字典,可选。
确定如何为
style变量的不同级别绘制线条的对象。设置为True将使用默认的短划线代码,或者您可以将短划线代码列表或style变量的字典映射级别传递给短划线代码。设置为False将对所有子集使用实线。线段在 matplotlib 中指定:(segment, gap)长度的元组,或用于绘制实线的空字符串。
markers: 布尔值,列表或字典,可选。
确定如何为
style变量的不同级别绘制标记的对象。 设置为“True”将使用默认标记,或者您可以传递标记列表或将style变量的字典映射到标记。 设置为“False”将绘制无标记线。 标记在 matplotlib 中指定。
style_order:列表,可选。
指定
style变量级别的出现顺序,否则它们是从数据中确定的。style变量时数字不相关的。
units: {long_form_var}
对变量识别抽样单位进行分组。使用时,将为每个单元绘制一个单独的行,并使用适当的语义。但不会添加任何图里条目。当不需要确切的身份时,可用于显示实验重复的分布。
estimator:pandas 方法的名称或可调用或无,可选。
在相同的
x级别上聚合y变量的多个观察值的方法。如果None,将绘制所有观察结果。
ci:整数或sd或 None。可选。
与
estimator聚合时绘制的置信区间大小。sd表示绘制数据的标准偏差。设置为None将跳过 bootstrap。
n_boot:整数,可选。
用于计算置信区间的 bootstrap 数。
sort:布尔值,可选。
如果为真,则数据将按 x 与 y 变量排序,否则行将按照它们在数据集中出现的顺序连接点。
err_style: band或bars,可选。
是否用半透明误差带或离散误差棒绘制置信区间。
err_band:关键字参数字典。
用于控制误差线美观的附加参数。
kwargs传递给ax.fill_between或ax.errorbar,具体取决于err_style。
legend: brief,full,或False。可选。
如何绘制图例。如果
brief,则数字hue和size变量将用均匀间隔值的样本表示。如果full,则每个组都会在图例中输入一个条目。如果为False,则不添加图例数据且不绘制图例。
ax:matplotlib 轴。可选。
将绘图绘制到的 Axes 对象,否则使用当前轴。
kwargs:关键,价值映射。
其他关键字参数在绘制时传递给
plt.plot。
返回值:ax:matplotlib 轴
返回 Axes 对象,并在其上绘制绘图。
也可以看看
显示两个变量之间的关系,而不强调x变量的连续性。当两个变量时分类时,显示两个变量之间的关系。
例子
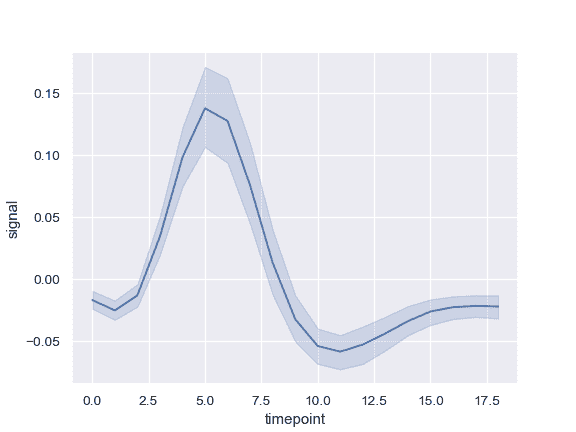
绘制单线图,其中错误带显示执行区间:
>>> import seaborn as sns; sns.set()
>>> import matplotlib.pyplot as plt
>>> fmri = sns.load_dataset("fmri")
>>> ax = sns.lineplot(x="timepoint", y="signal", data=fmri)
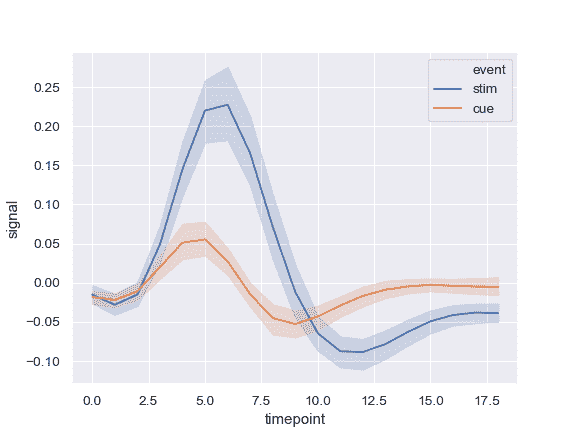
按另一个变量分组并显示具有不同颜色的组:
>>> ax = sns.lineplot(x="timepoint", y="signal", hue="event",
...                   data=fmri)
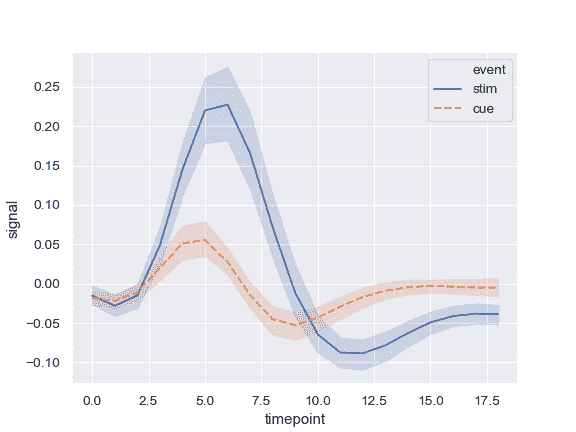
使用颜色和线条划线显示分组变量:
>>> ax = sns.lineplot(x="timepoint", y="signal",
...                   hue="event", style="event", data=fmri)
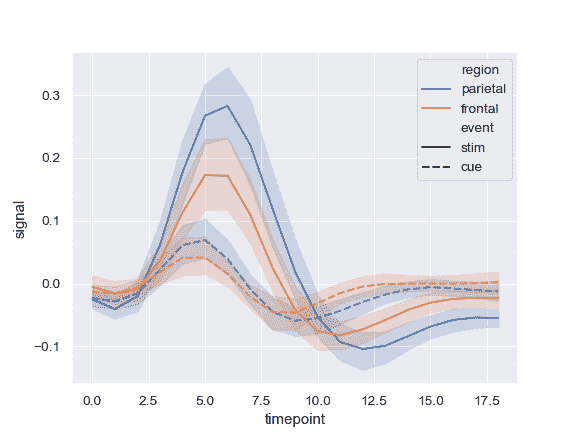
使用颜色和线条划线来表示两个不同的分组变量:
>>> ax = sns.lineplot(x="timepoint", y="signal",
...                   hue="region", style="event", data=fmri)
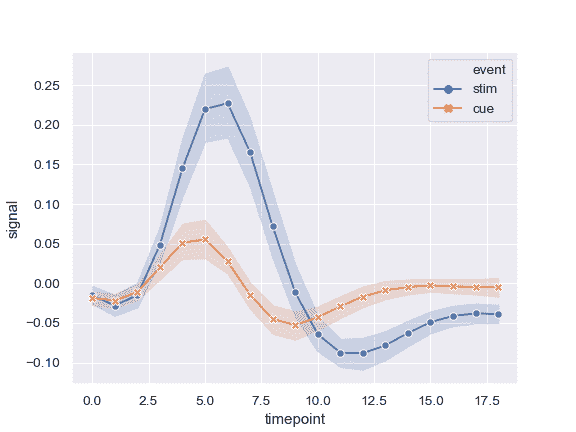
使用标记而不是破折号来标识组:
>>> ax = sns.lineplot(x="timepoint", y="signal",
...                   hue="event", style="event",
...                   markers=True, dashes=False, data=fmri)
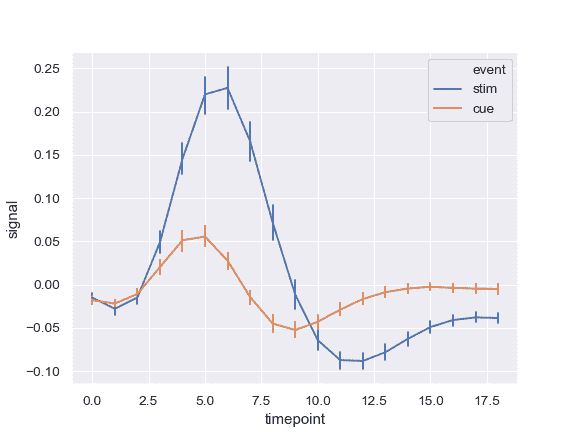
显示错误条而不是错误带并绘制标准错误:
>>> ax = sns.lineplot(x="timepoint", y="signal", hue="event",
...                   err_style="bars", ci=68, data=fmri)
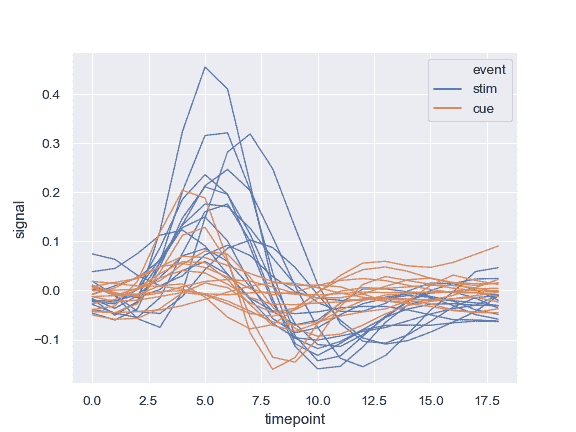
显示实验性重复而不是聚合:
>>> ax = sns.lineplot(x="timepoint", y="signal", hue="event",
...                   units="subject", estimator=None, lw=1,
...                   data=fmri.query("region == 'frontal'"))
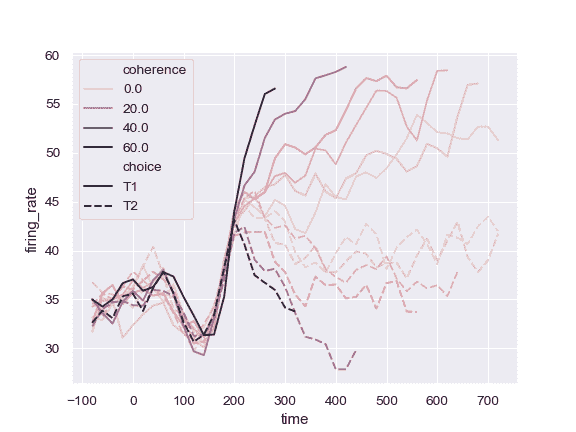
使用定量颜色映射:
>>> dots = sns.load_dataset("dots").query("align == 'dots'")
>>> ax = sns.lineplot(x="time", y="firing_rate",
...                   hue="coherence", style="choice",
...                   data=dots)
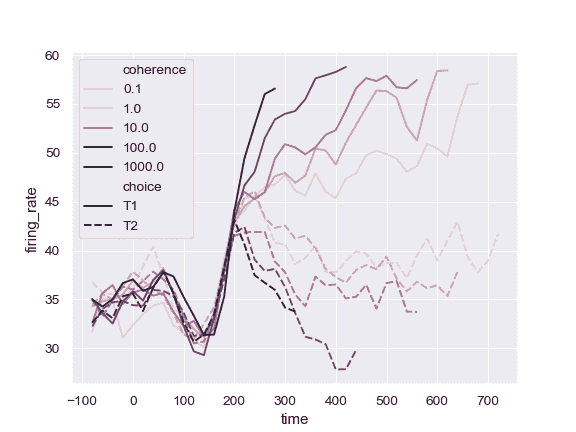
对 colormap 使用不同的归一化:
>>> from matplotlib.colors import LogNorm
>>> ax = sns.lineplot(x="time", y="firing_rate",
...                   hue="coherence", style="choice",
...                   hue_norm=LogNorm(), data=dots)
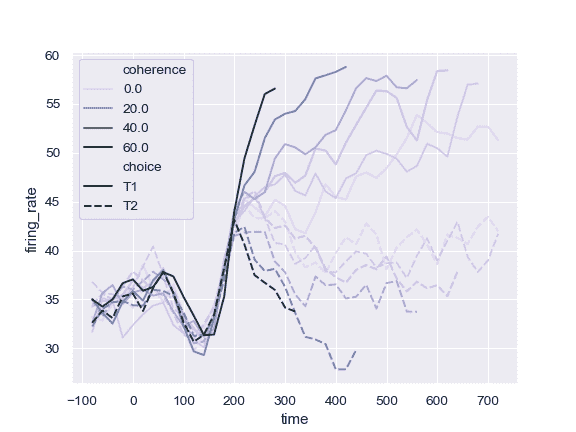
使用不同的调色板:
>>> ax = sns.lineplot(x="time", y="firing_rate",
...                   hue="coherence", style="choice",
...                   palette="ch:2.5,.25", data=dots)
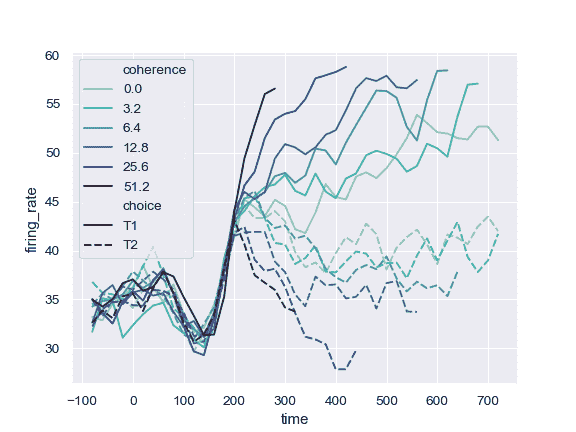
使用特定颜色值,将 hue 变量视为分类:
>>> palette = sns.color_palette("mako_r", 6)
>>> ax = sns.lineplot(x="time", y="firing_rate",
...                   hue="coherence", style="choice",
...                   palette=palette, data=dots)
使用定量变量更改线条的宽度:
>>> ax = sns.lineplot(x="time", y="firing_rate",
...                   size="coherence", hue="choice",
...                   legend="full", data=dots)
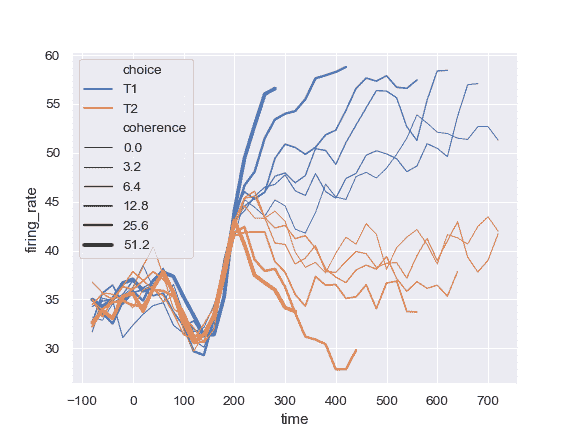
更改用于规范化 size 变量的线宽范围:
>>> ax = sns.lineplot(x="time", y="firing_rate",
...                   size="coherence", hue="choice",
...                   sizes=(.25, 2.5), data=dots)
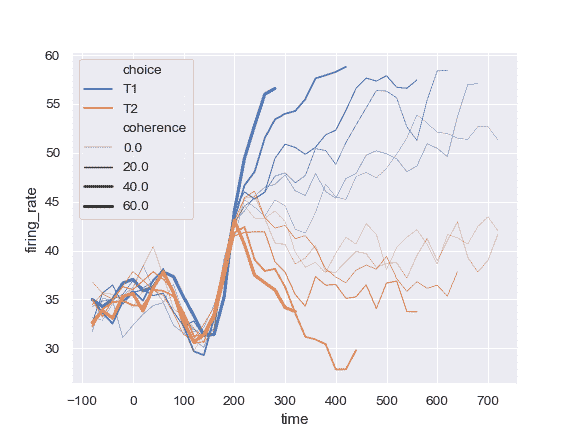
DataFrame 绘制:
>>> import numpy as np, pandas as pd; plt.close("all")
>>> index = pd.date_range("1 1 2000", periods=100,
...                       freq="m", name="date")
>>> data = np.random.randn(100, 4).cumsum(axis=0)
>>> wide_df = pd.DataFrame(data, index, ["a", "b", "c", "d"])
>>> ax = sns.lineplot(data=wide_df)
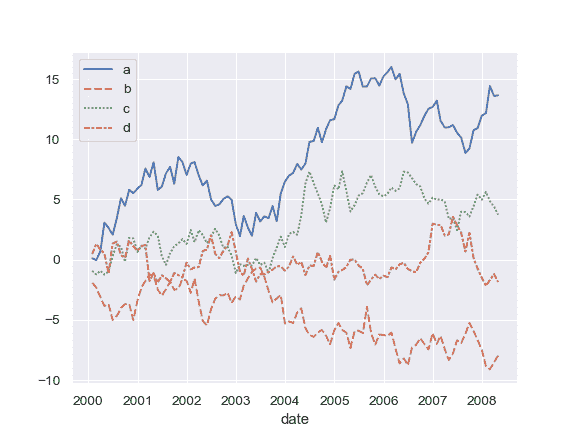
系列列表中绘制:
>>> list_data = [wide_df.loc[:"2005", "a"], wide_df.loc["2003":, "b"]]
>>> ax = sns.lineplot(data=list_data)
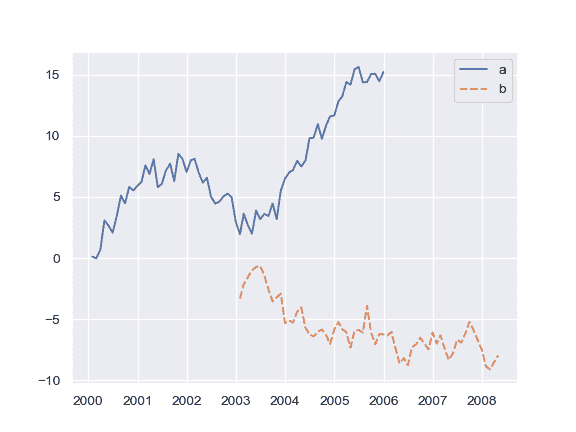
绘制单个系列,将 kwargs 传递给plt.plot:
>>> ax = sns.lineplot(data=wide_df["a"], color="coral", label="line")
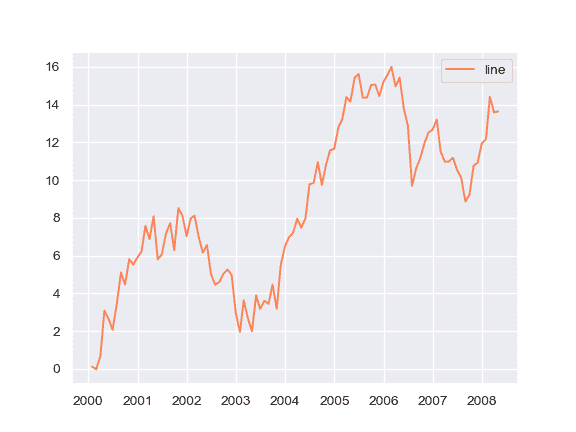
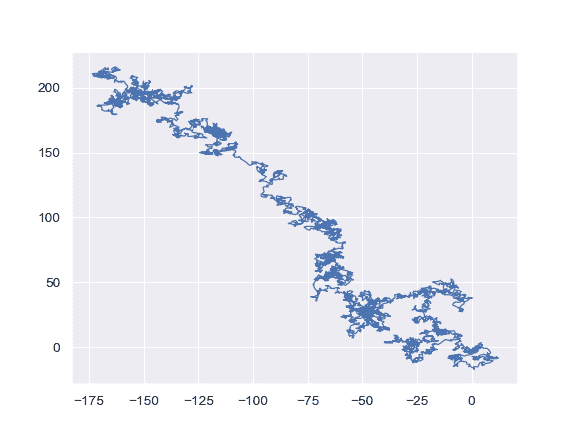
在数据集中出现的点处绘制线条:
>>> x, y = np.random.randn(2, 5000).cumsum(axis=1)
>>> ax = sns.lineplot(x=x, y=y, sort=False, lw=1)
